Getting Started With TailCtrl
This post explains how to send OpenTelemetry traces to a TailCtrl agent. We aim to make the process as smooth as possible - it can be broken down into three steps.
2. Instrument a service with OpenTelemetry
3. Configure the instrumentation's trace span exporter
Let's get started!
Deploy a TailCtrl agent
TailCtrl makes agent installation straightforward, with Linux native package repositories (for rpm and deb) and a docker image. To deploy an agent, log into your account, and navigate to the "Agents" page.
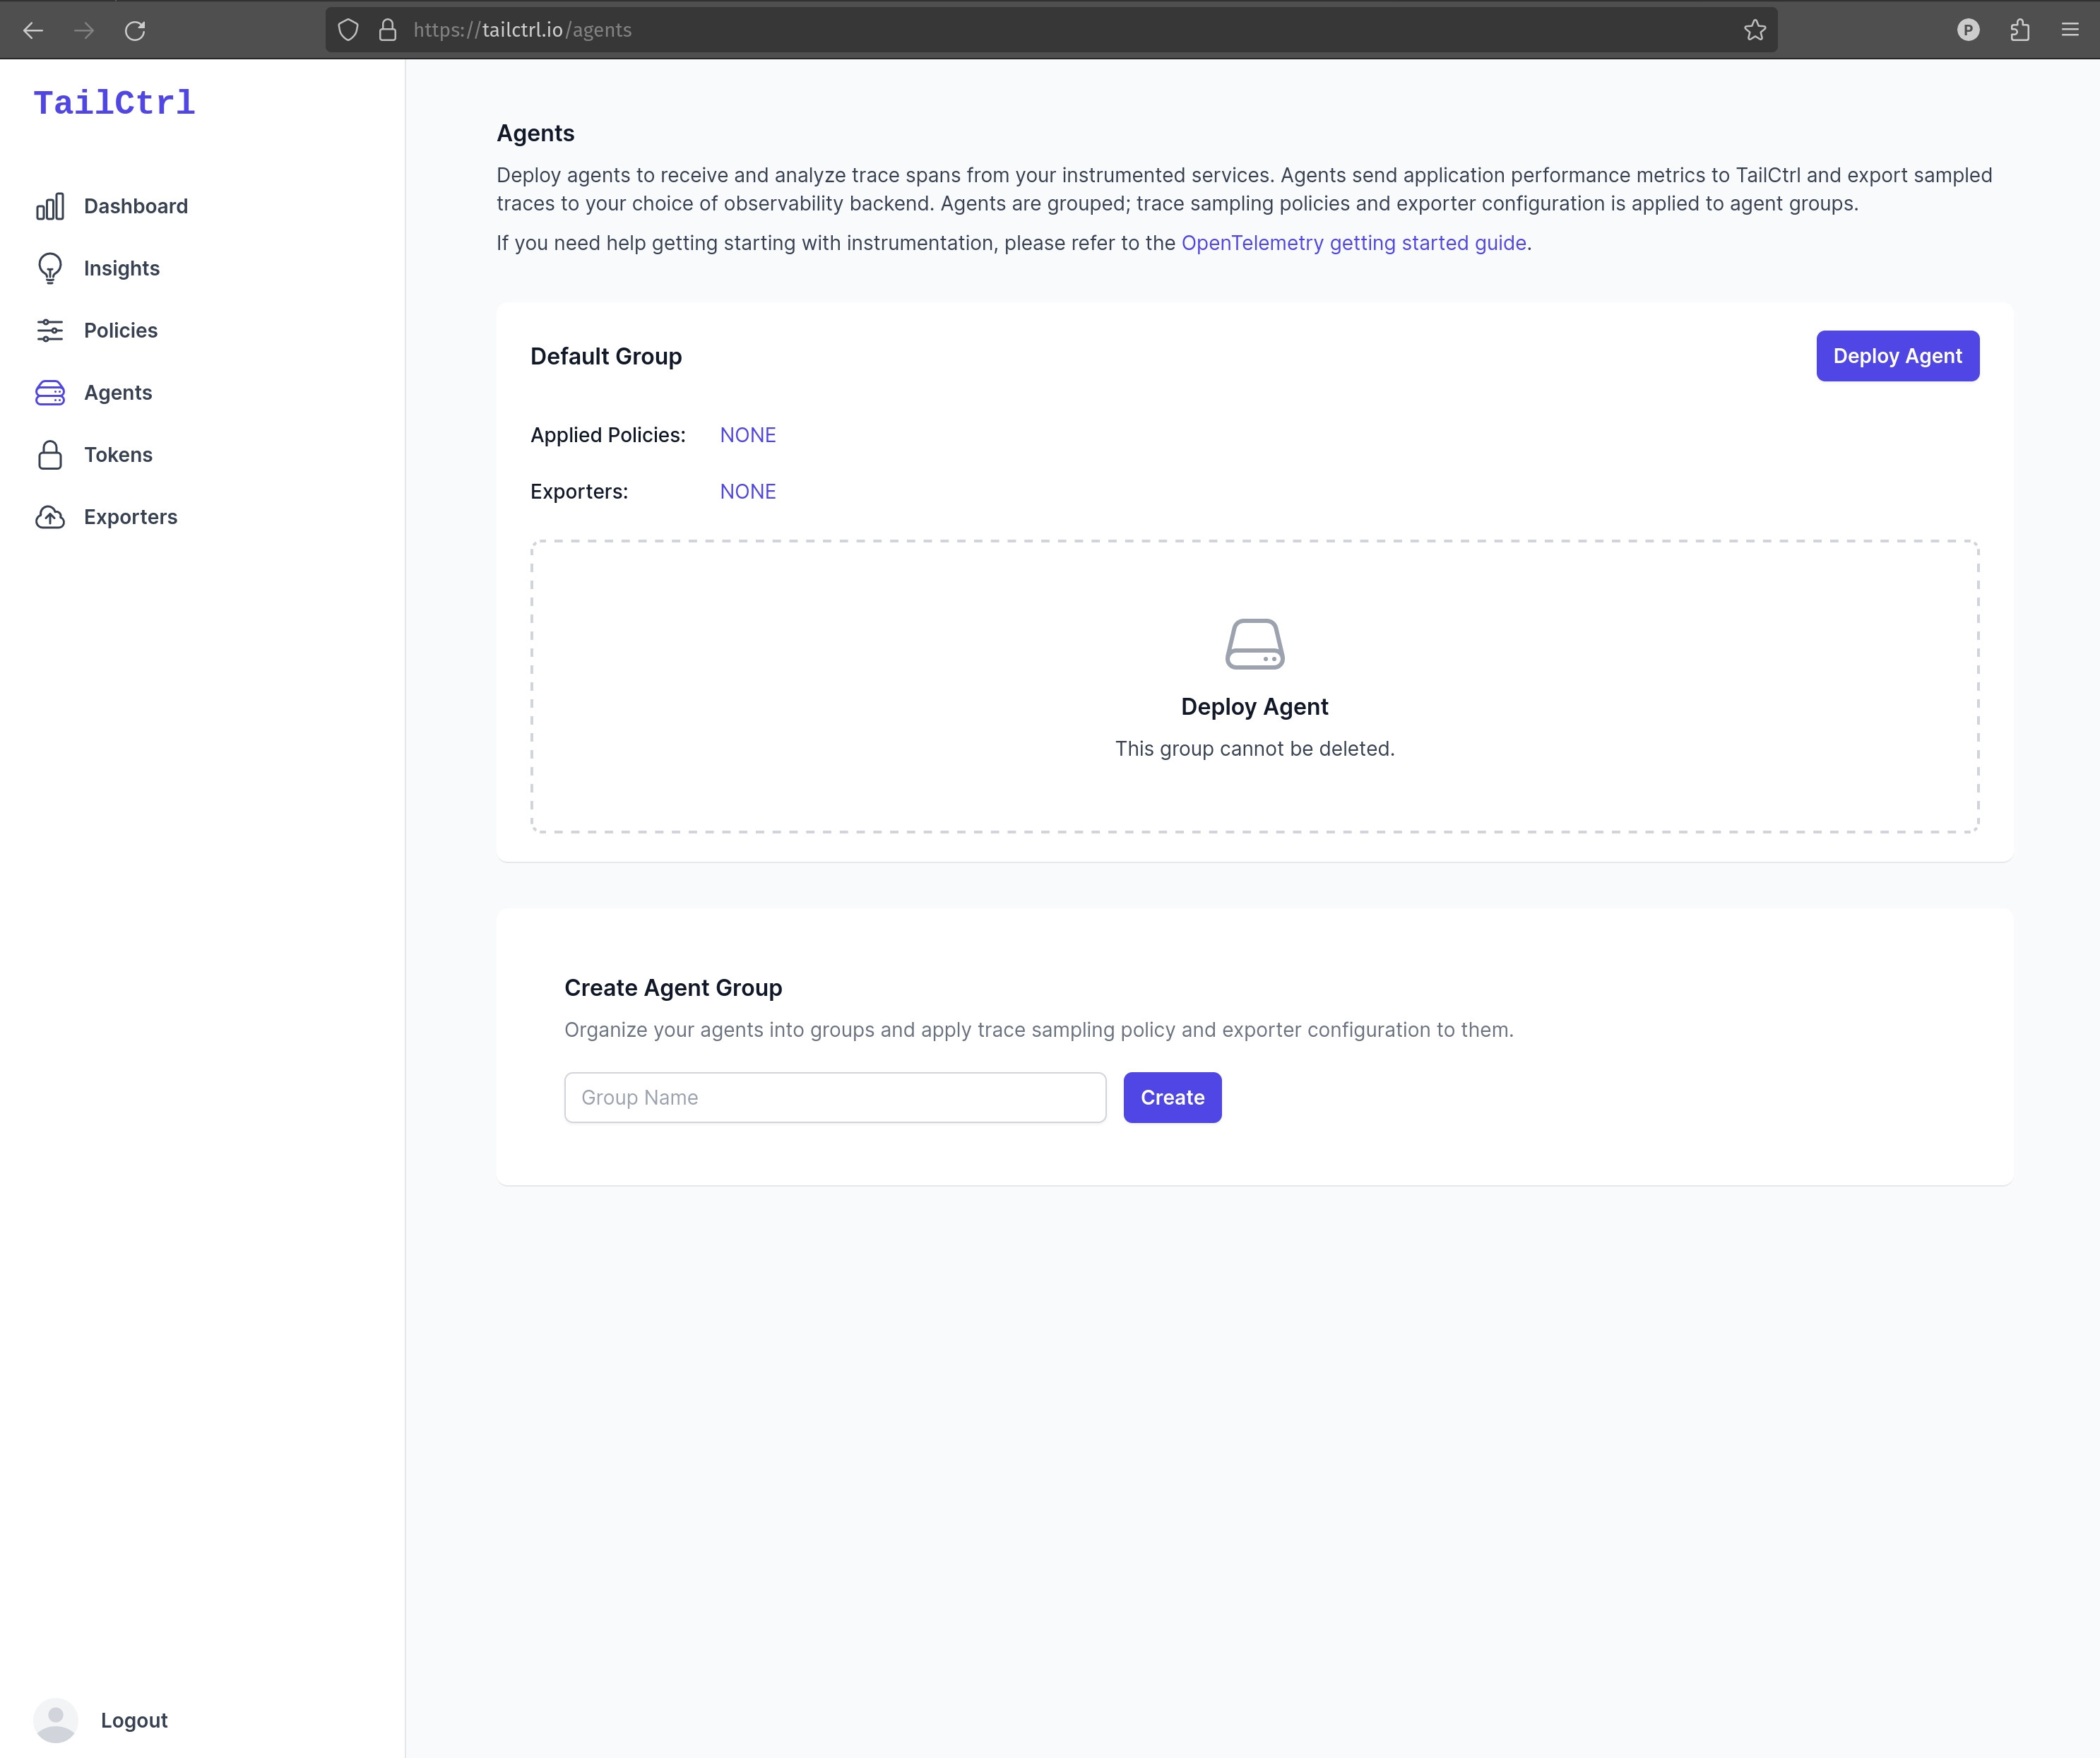
Next, click the "Deploy Agent" button to navigate to the agent deployment wizard 🧙 You will be guided to use one of the personalized one-liners (for Linux, Docker, or Kubernetes) or you may choose to follow the manual instructions.
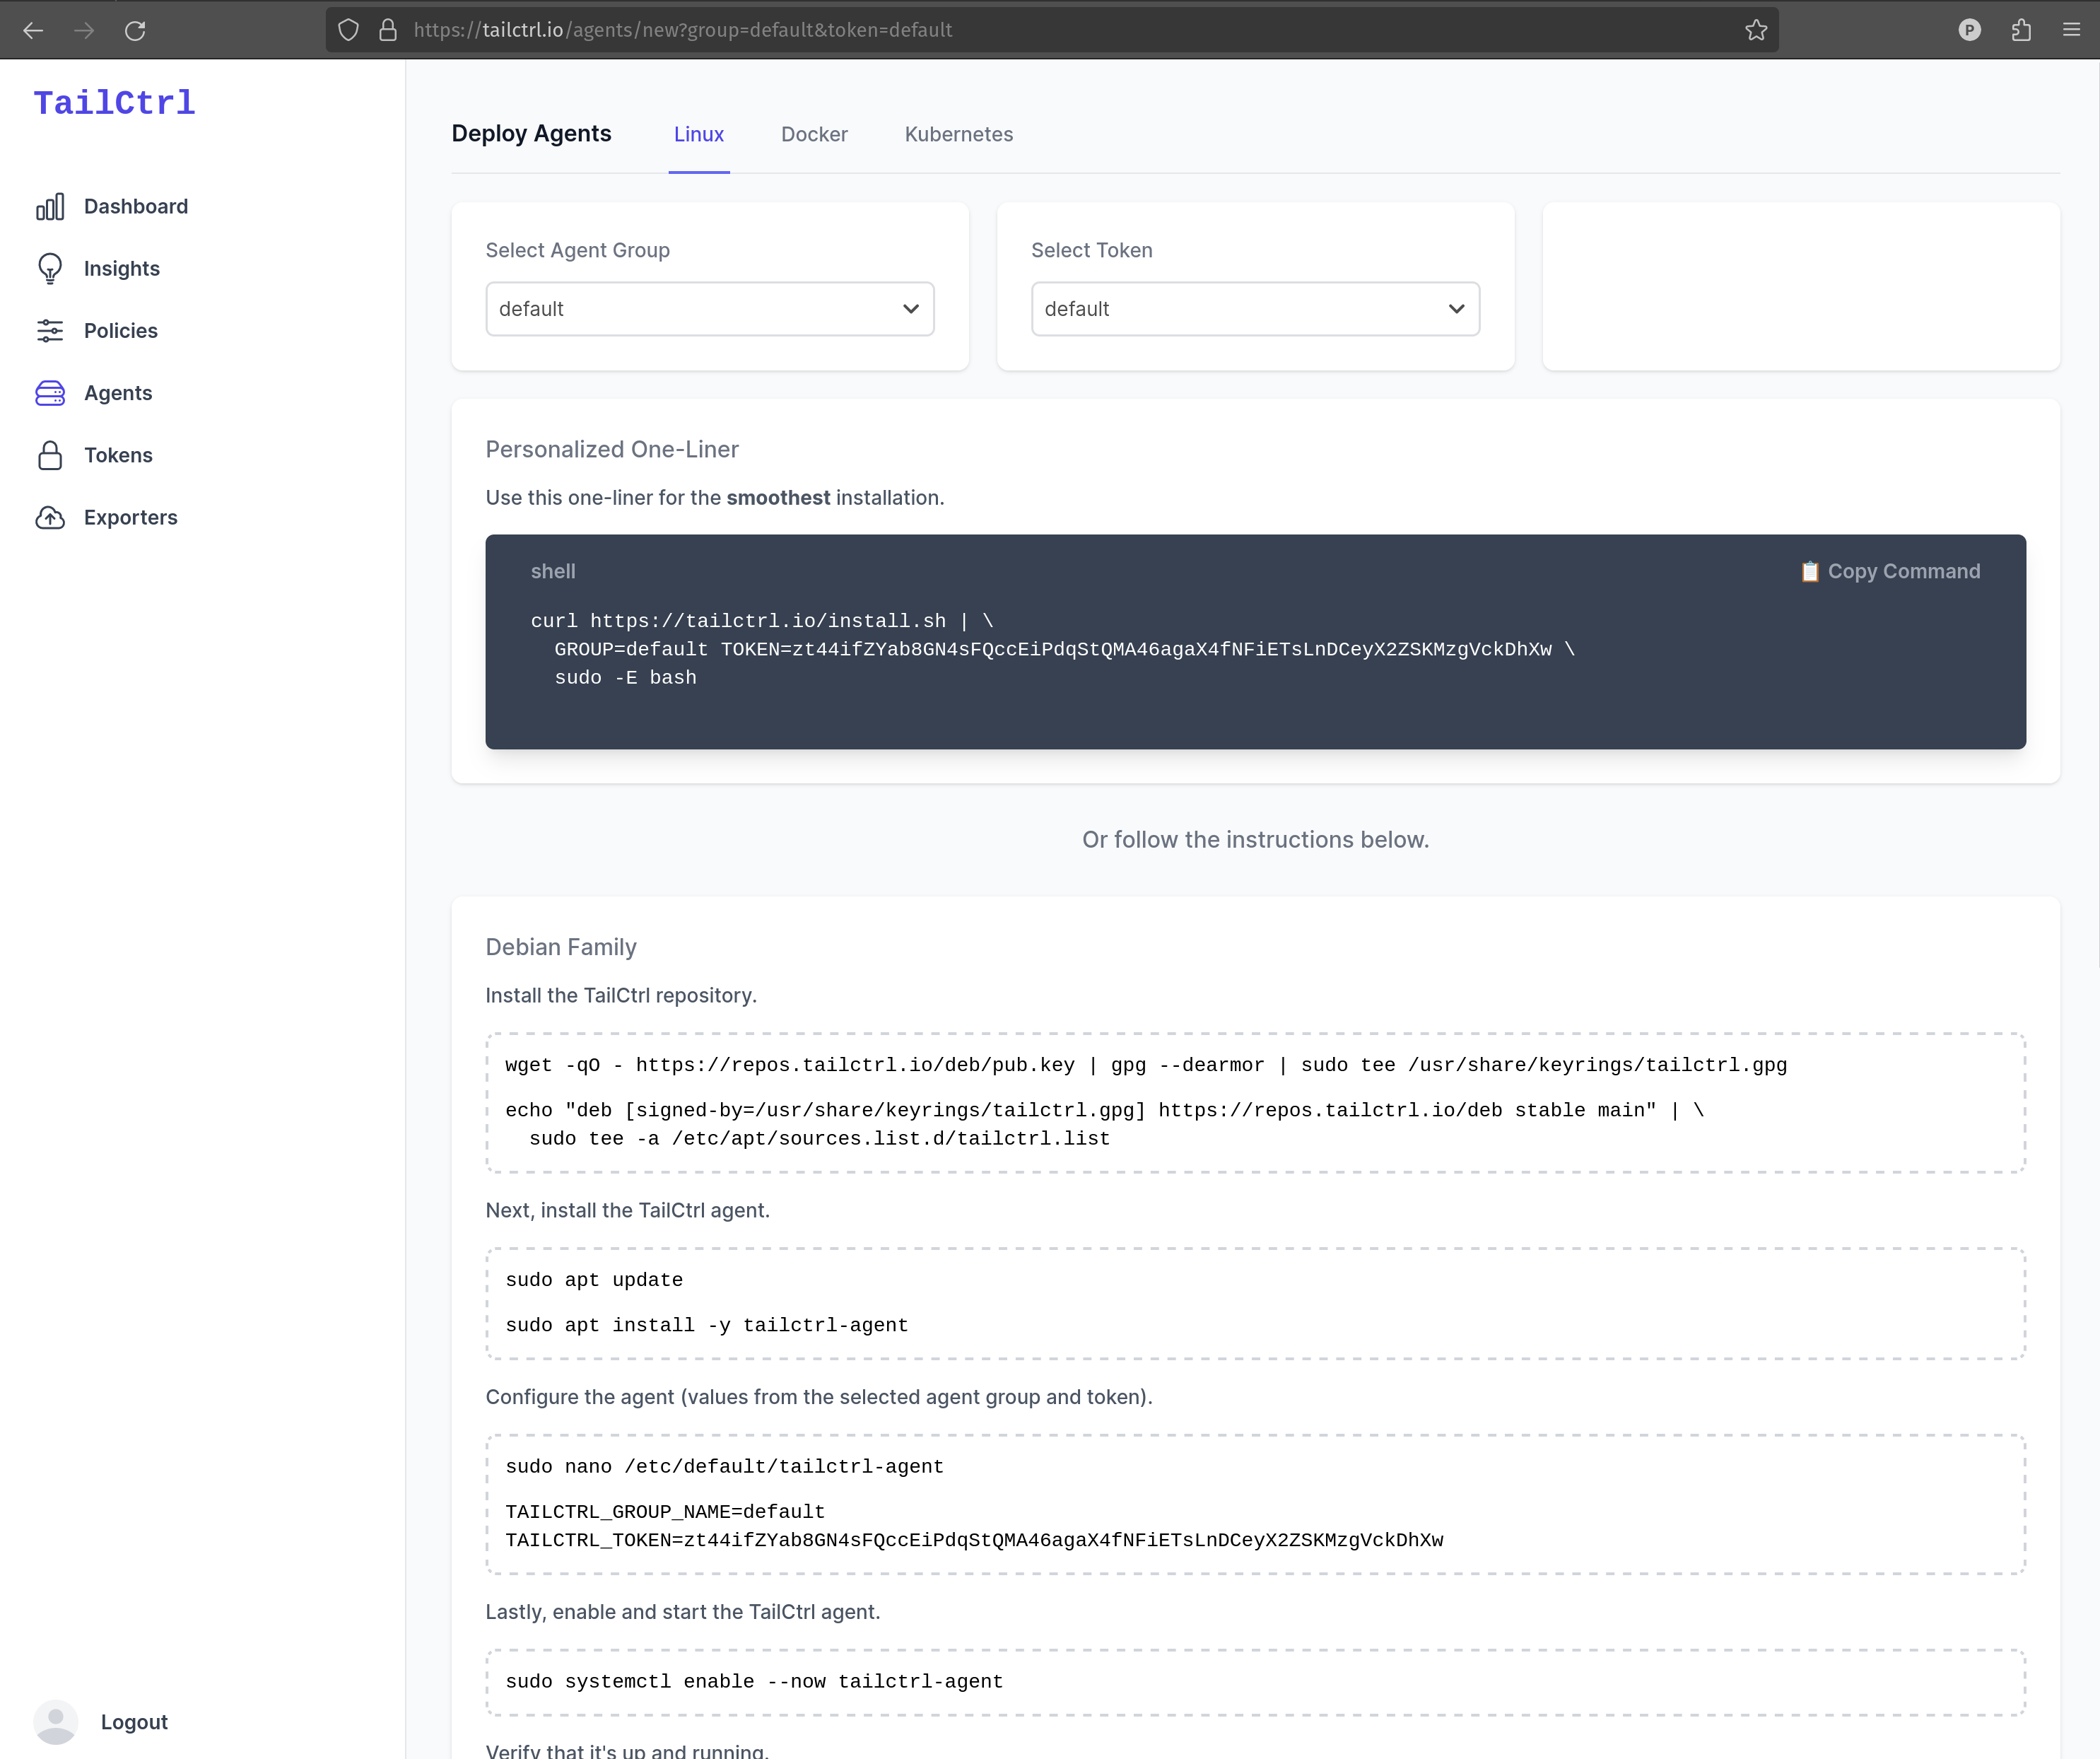
Congratulations! You have deployed a TailCtrl agent! Once running, the agent will be listening for OTLP data on two TCP ports, 4317 (gRPC), and 4318 (HTTP). You will send your trace spans to either of these ports in a later step.
Instrument a service with OpenTelemetry
Instrumenting a service may seem like a daunting task, however, OpenTelemetry makes it easy to get started! Code instrumentation is supported for the majority of modern programming languages and frameworks. Auto-instrumentation exist for the most popular libraries, automatically injecting instrumentation for you, greatly accelerating your rollout. The OpenTelemetry getting started guide is the best resource to begin with. Once you start, it's tough to stop, you will continue to increase visibility into your distributed services. It can be addicting!
This is the way.
The TailCtrl services, which are written in Go and Ruby (Rails), are instrumented with OpenTelemetry. The following instrumentation guides helped us set up distributed tracing.
Configure the instrumentation's trace span exporter
Now that you have deployed a TailCtrl agent and instrumented a service, it's time to send your traces to TailCtrl! As previously mentioned, the TailCtrl agent listens for OTLP data on two TCP ports, 4317 (gRPC), and 4318 (HTTP). Your service will send trace spans to either of these listeners. In order to send your service trace spans to the agent, you must configure the instrumentation's OTLP exporter. Configuration differs between language SDKs, it's best to refer to the official documentation.
In order to observe TailCtrl with TailCtrl, we used the following OTLP exporter documentation to send our trace spans to our agent's OTLP HTTP listener (TCP 4318).
If you have more than one service, it's important that all spans for a distributed trace are sent to the same TailCtrl agent. The agent requires all of the spans in order to make a sampling decision. A future post will cover securing and scaling the TailCtrl agent.
What's Next?
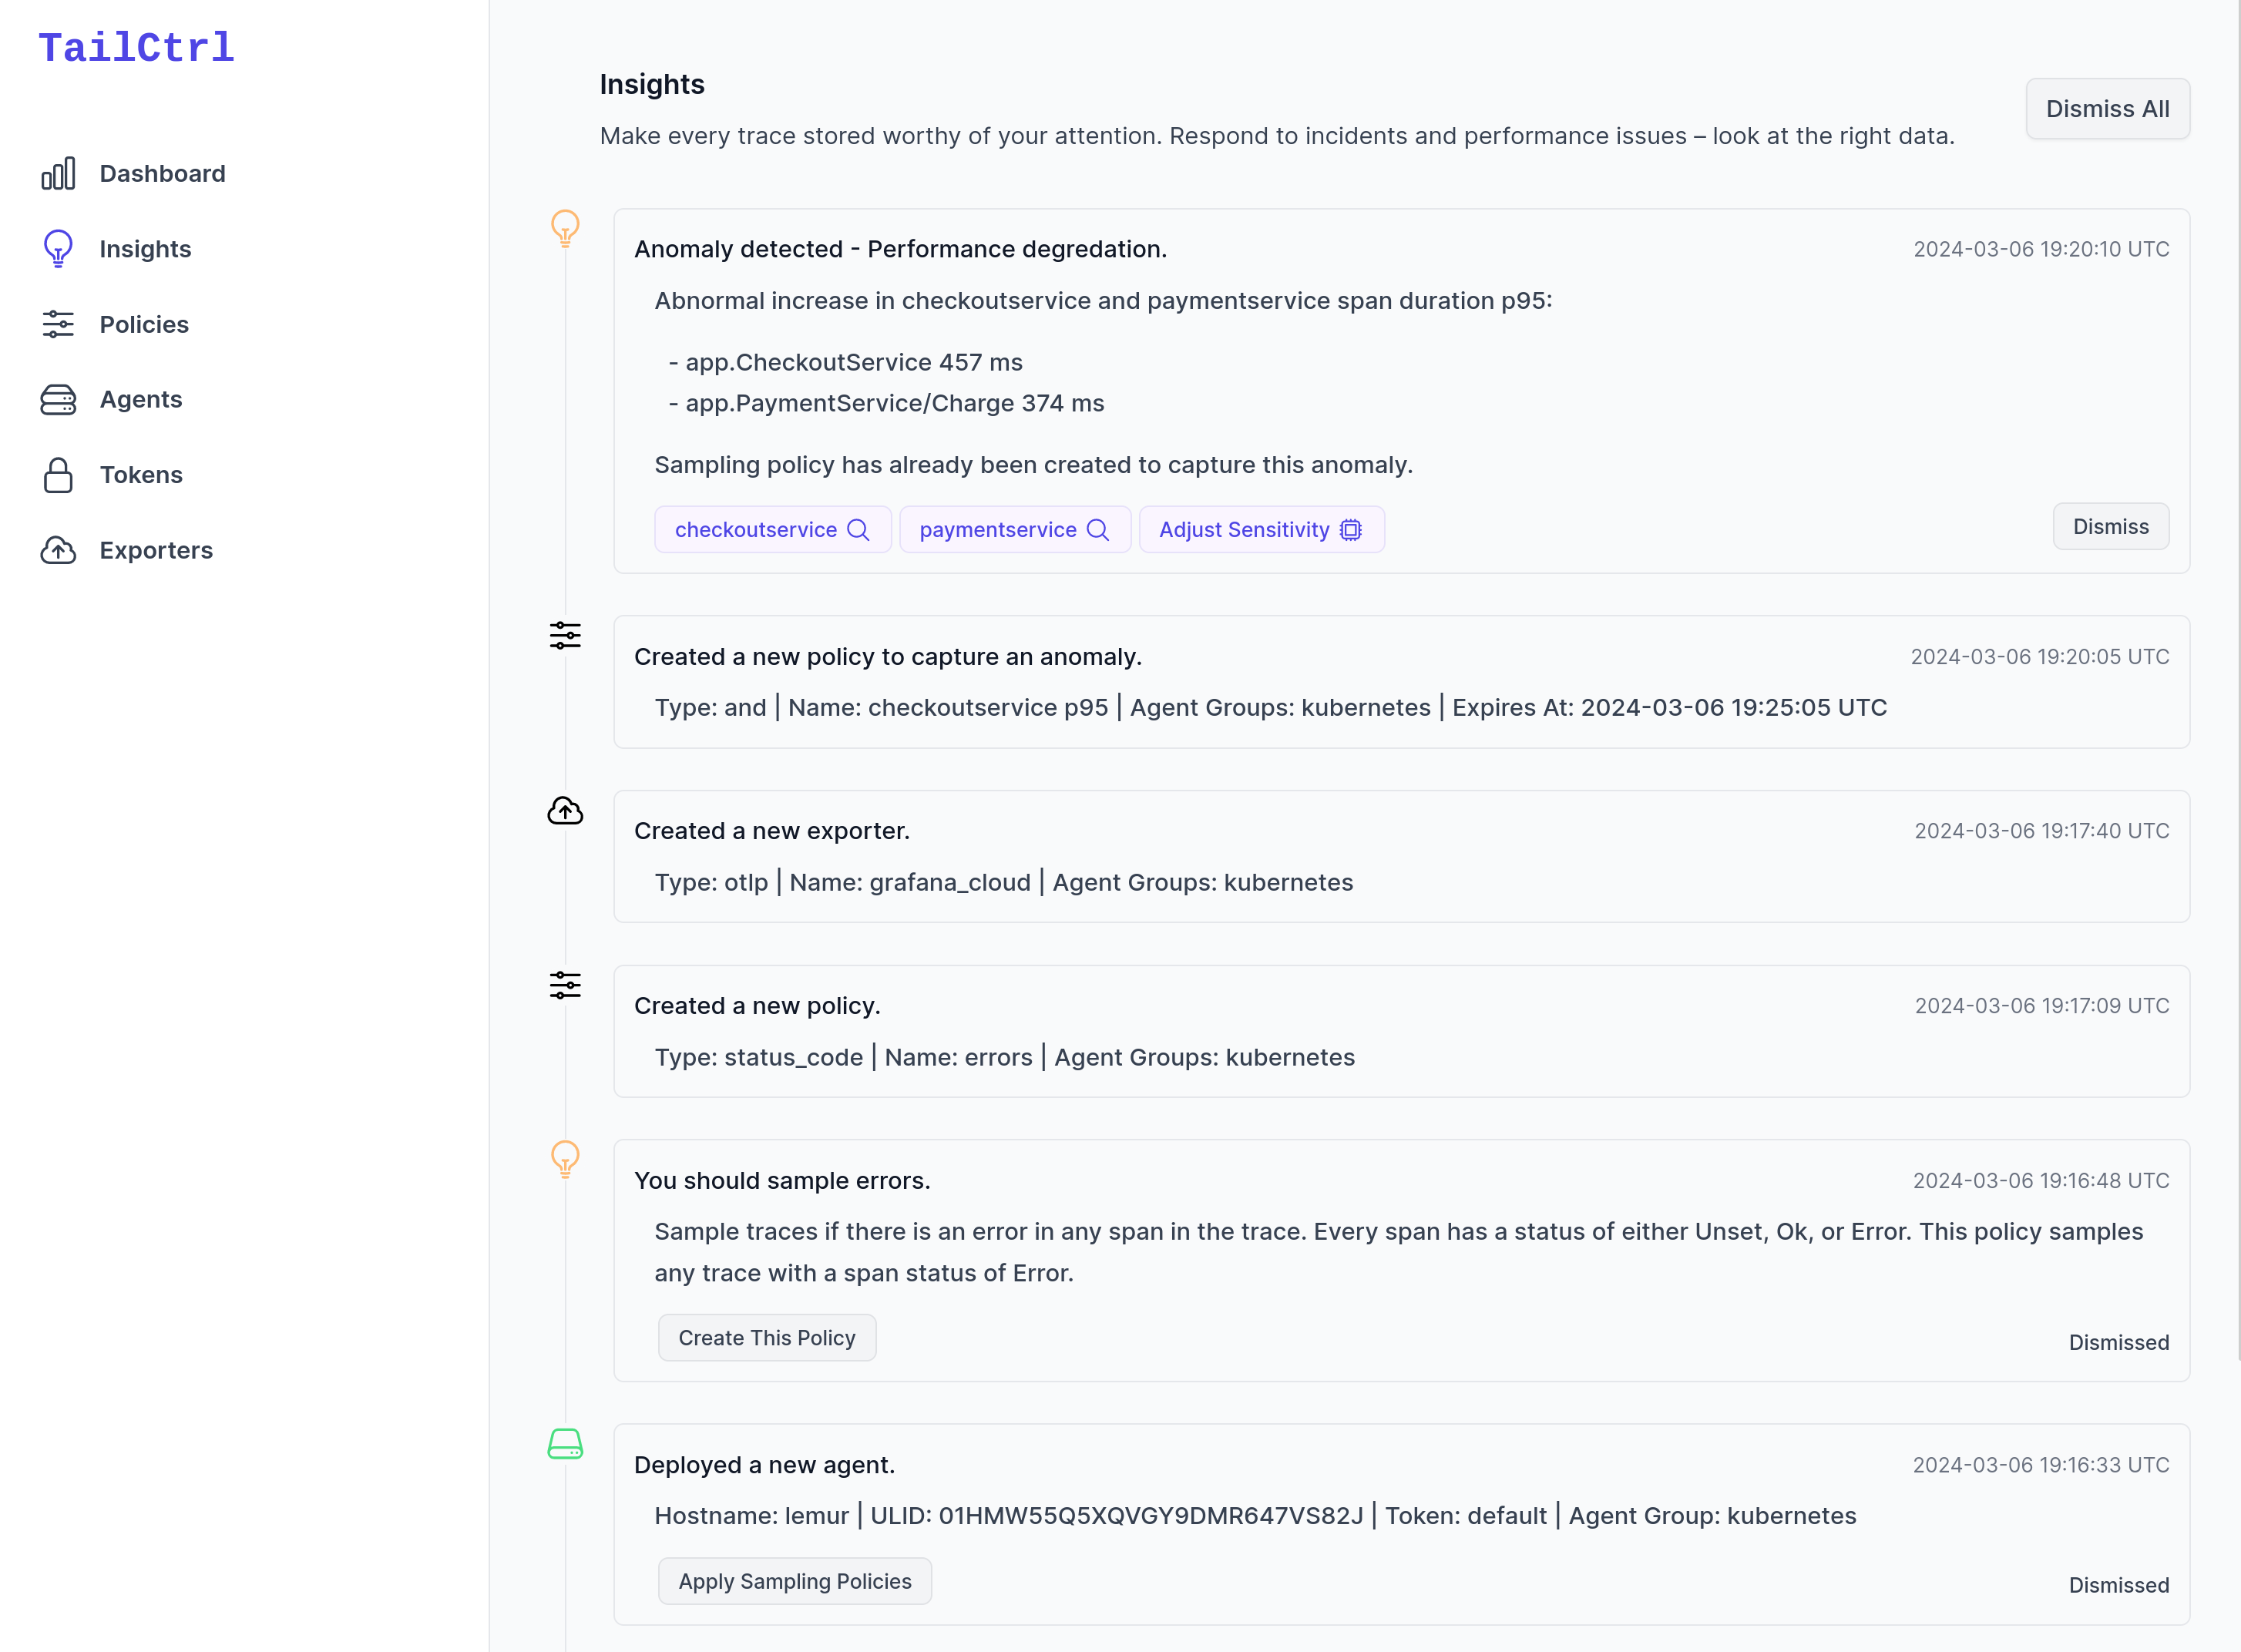
Navigate to the "Insights" page to begin your TailCtrl journey!
Founder